Data & Reporting
Downtown Halifax Business Commission (DHBC) works daily to identify the challenges and the opportunities for our 1,600+ members, priding ourselves on being known as "the go-to resource" for all things Downtown Halifax.
We acknowledge the hyperdynamic nature of the current business environment, and as such, are data driven, assuring our opinions and actions are based on research and evidence.
2025-2026 Annual Report
Other Documents
-
2026-2030 Strategic Plan
-
Downtown Halifax Vision 2030
On June 5, 2024, DHBC released Downtown Halifax Vision 2030! This report identifies four transformational moves; Everybody’s Neighbourhood, Harbour 365, Entertainment Central, and Move Smart.
For all things Vision 2030 visit the dedicated page here: https://downtownhalifax.ca/vision2030
-
Choose Downtown Halifax!
Thinking of joining the Downtown Halifax family? This should help.
Choose Downtown Halifax!, DHBC's 2024 Business Recruitment Booklet.
State of the Downtown
When DHBC released the first edition of the 'State of the Downtown' report in 2023, it was done for two reasons:
- To see what relevant data was available and to give our membership a full and accurate picture of what was happening Downtown.
- To cement DHBC’s position as an authority for all things Downtown.
Now, with our third report out, we'd like to think we're not just experts on Downtown, but also the curators. We want to not only understand the trends, but to drive the trends. Through data collection and analysis, we hope to draw a compelling picture of what is happening now, and how to maintain those things that are positive, while altering the course of trends we deem to be negative.
We wish to reassure you that the data on these pages is meant to accurately present what is happening in Downtown Halifax in an unbiased manner (both the good and the bad).
Read the 2025 State of the Downtown Report below.
2025 State of the Downtown
2025 State of the Downtown Report (June 2025)
2024 State of the Downtown
2024 State of the Downtown Report (June 2024)
2023 State of the Downtown
2023 State of the Downtown Report (June 2023)
Visitation & Sales Data
Investment (Development) Tracking
-
Downtown Development MapImage
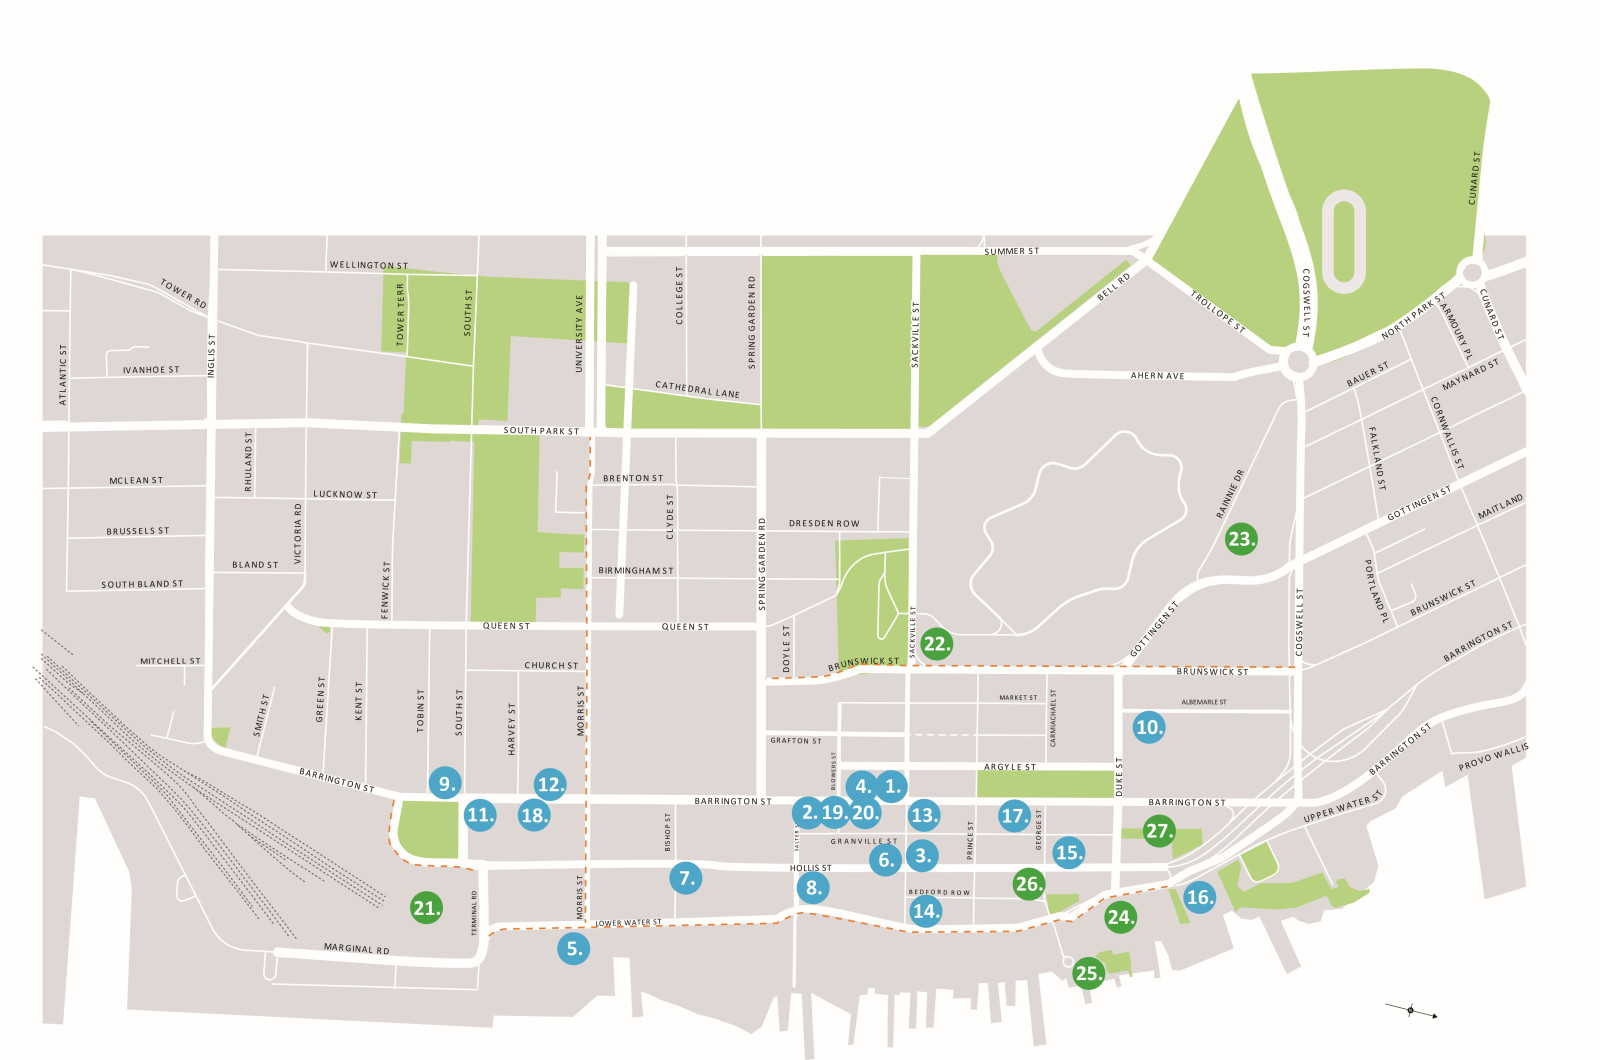
To see a bigger representation of this map please visit our live Google Map by clicking here.
-
HRM's Permit Map
HRM's Permit Status Map includes various Permitting, Planning, Licensing & Compliance permit datasets.
View it here: https://www.halifax.ca/home-property/building-development-permits/permit-volume-processing-times/permit-status-map